我的投资理念和开源项目fooltrader
且说投资理念吧:
- 全市场(股票,期货,数字货币,债券等)
- 只做”明显的”底部(多),顶部(空)
- 基本面,技术面,政策面,资金面结合的”乘法原理”
- 分散投资
所以,大部分时间我是在写程序,看书,然后等待”那个点”的出现.
我不知道,为什么那么多人要么搞股票,要么搞期货,要么炒币,甚至只关心某某行业的几只票,研究得很”深入”,所谓”只搞自己懂的”.
然而,市场在干什么呢?
“成交量”会有一个基本的答案,如果很明显某某金属品种,技术上有底部特征,且成交量足够大,而股市已经明显走熊,成交萎靡,为啥还要赖在股市里面不走?去”陪伟大的企业成长”?
而即使你不懂”区块链”的意义,然而芝加哥商品上线了”比特币”期货,且流动性足够,你总不能继续骗自己——“那只是一个传销”.
我说这些,只是想说,不要被自己的”喜好”蒙蔽了双眼,拒绝充满活力的”少女”,而在”老媪”虔诚的灵魂中不能自拔.
为了践行这样的理念,人力为之是不可能的,这行情那行情这新闻那指标的,都去看不累死?人是不是应该把时间花在有意思一点的事情上?嗯,重复性的东西让程序去做,然而市面上的软件都太偏门了,不太可能完成这种复杂的任务,且各有一套,学习成本太高.
好吧,自己撸.爬虫,数据分类,存储,计算,回测,通知……只做我认为最有用的,尽量用现成的成熟组件,然后,就跑起来了……
直接传送项目地址
“要在市场上生存,就必须远离聪明,因为,你的聪明在市场面前一钱不值”——缠中说禅
且说开源的目的:
- 由于是全品种,爬虫会比较多,希望对此有兴趣的人能够加入进来,一起完善
- 有人免费帮找BUG,系统更稳定
- 有人点赞,我的虚荣心还是能够得到一些满足的——这是最重要的
下面展示几个使用场景:
自定义分析逻辑和视图
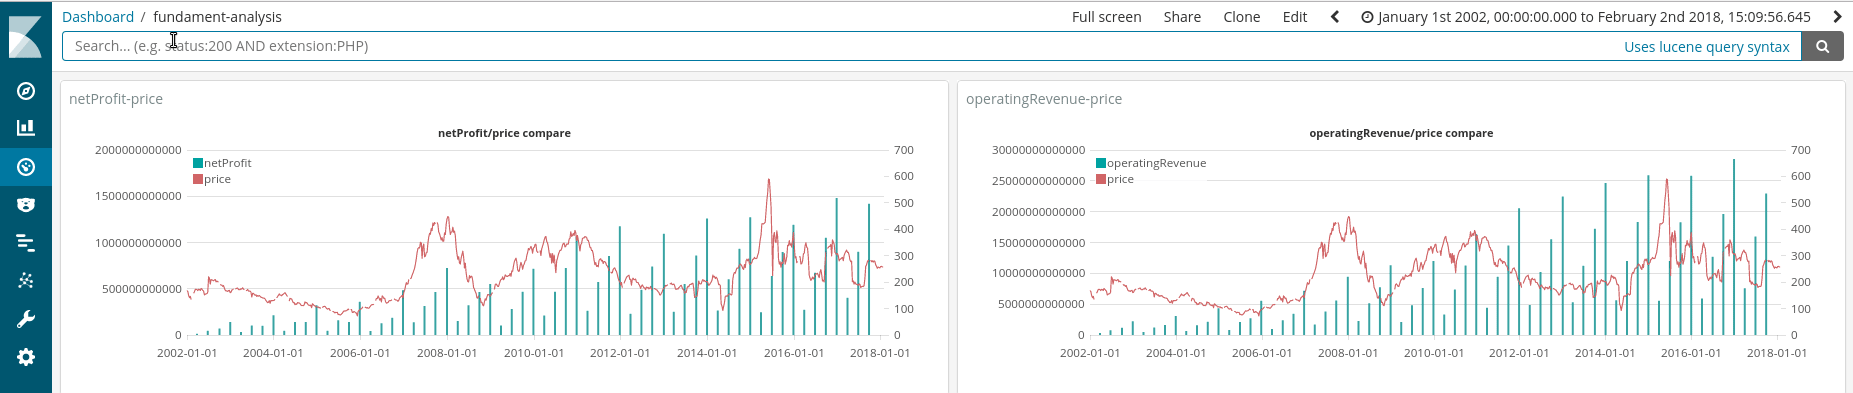
股价利润关系

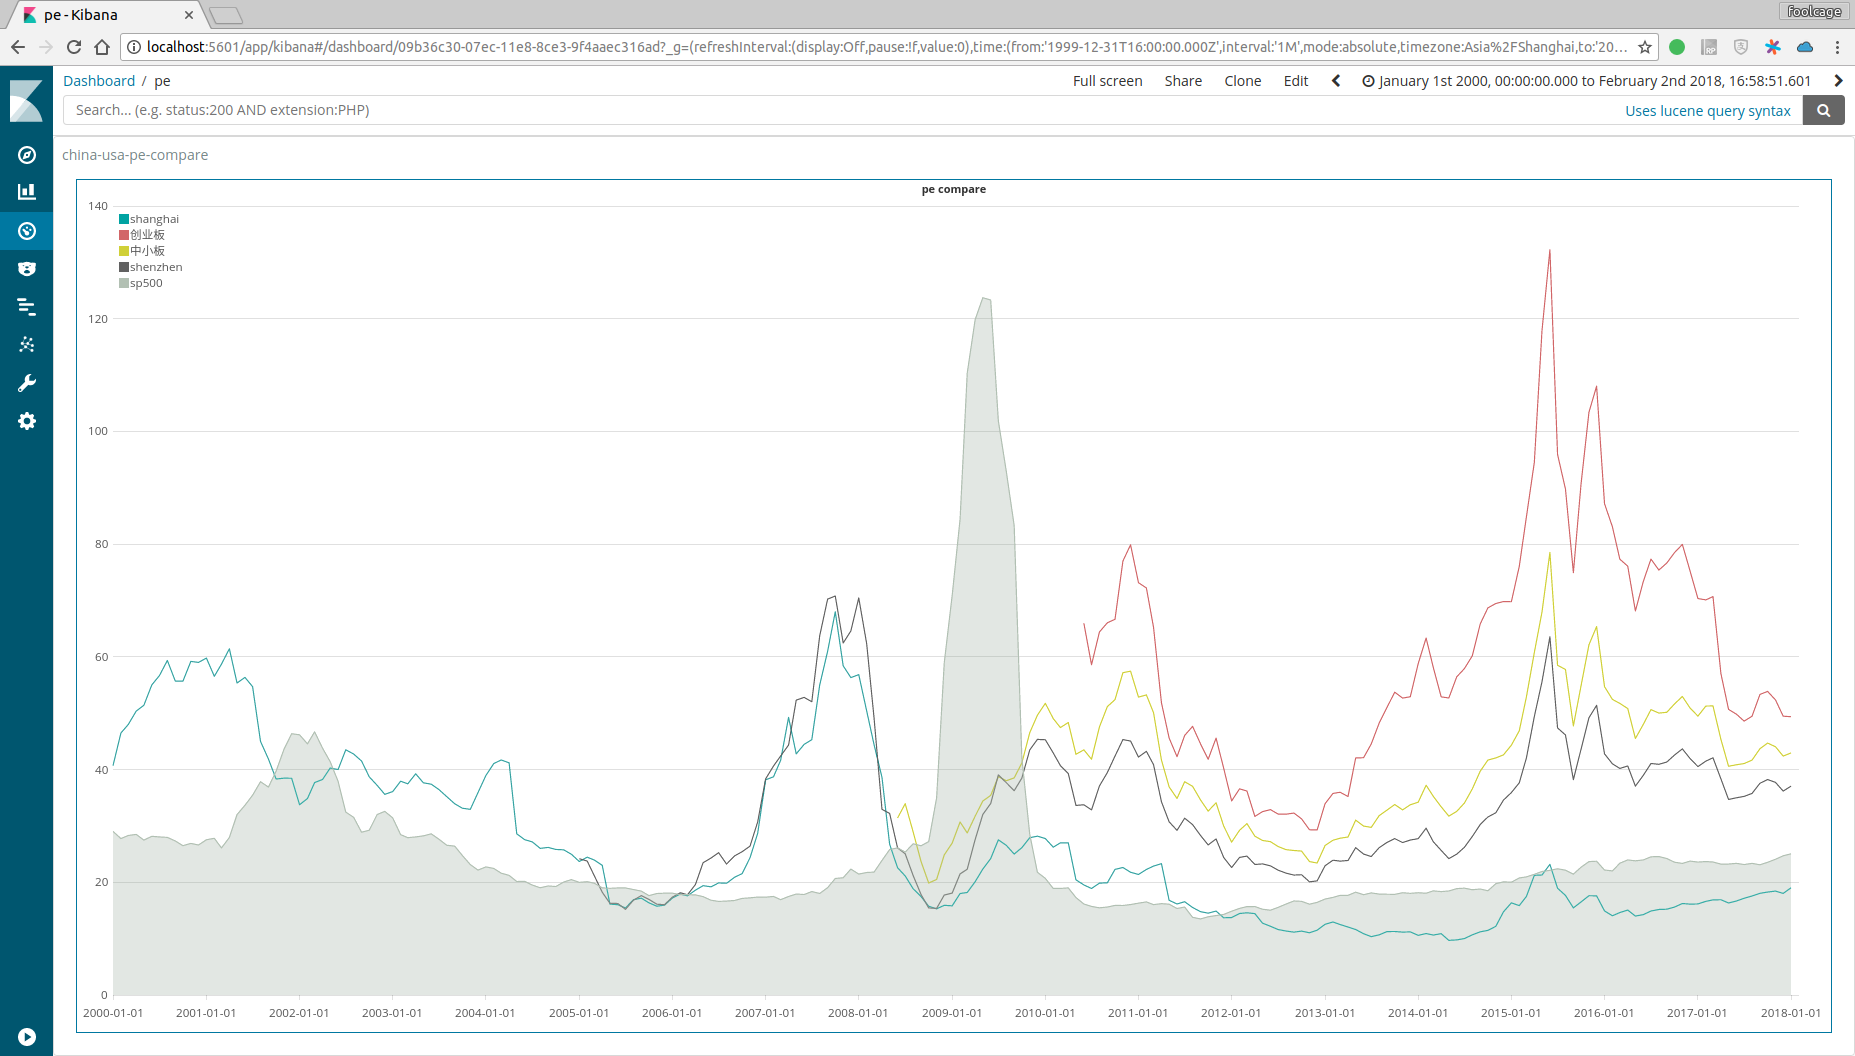
市场平均PE对比
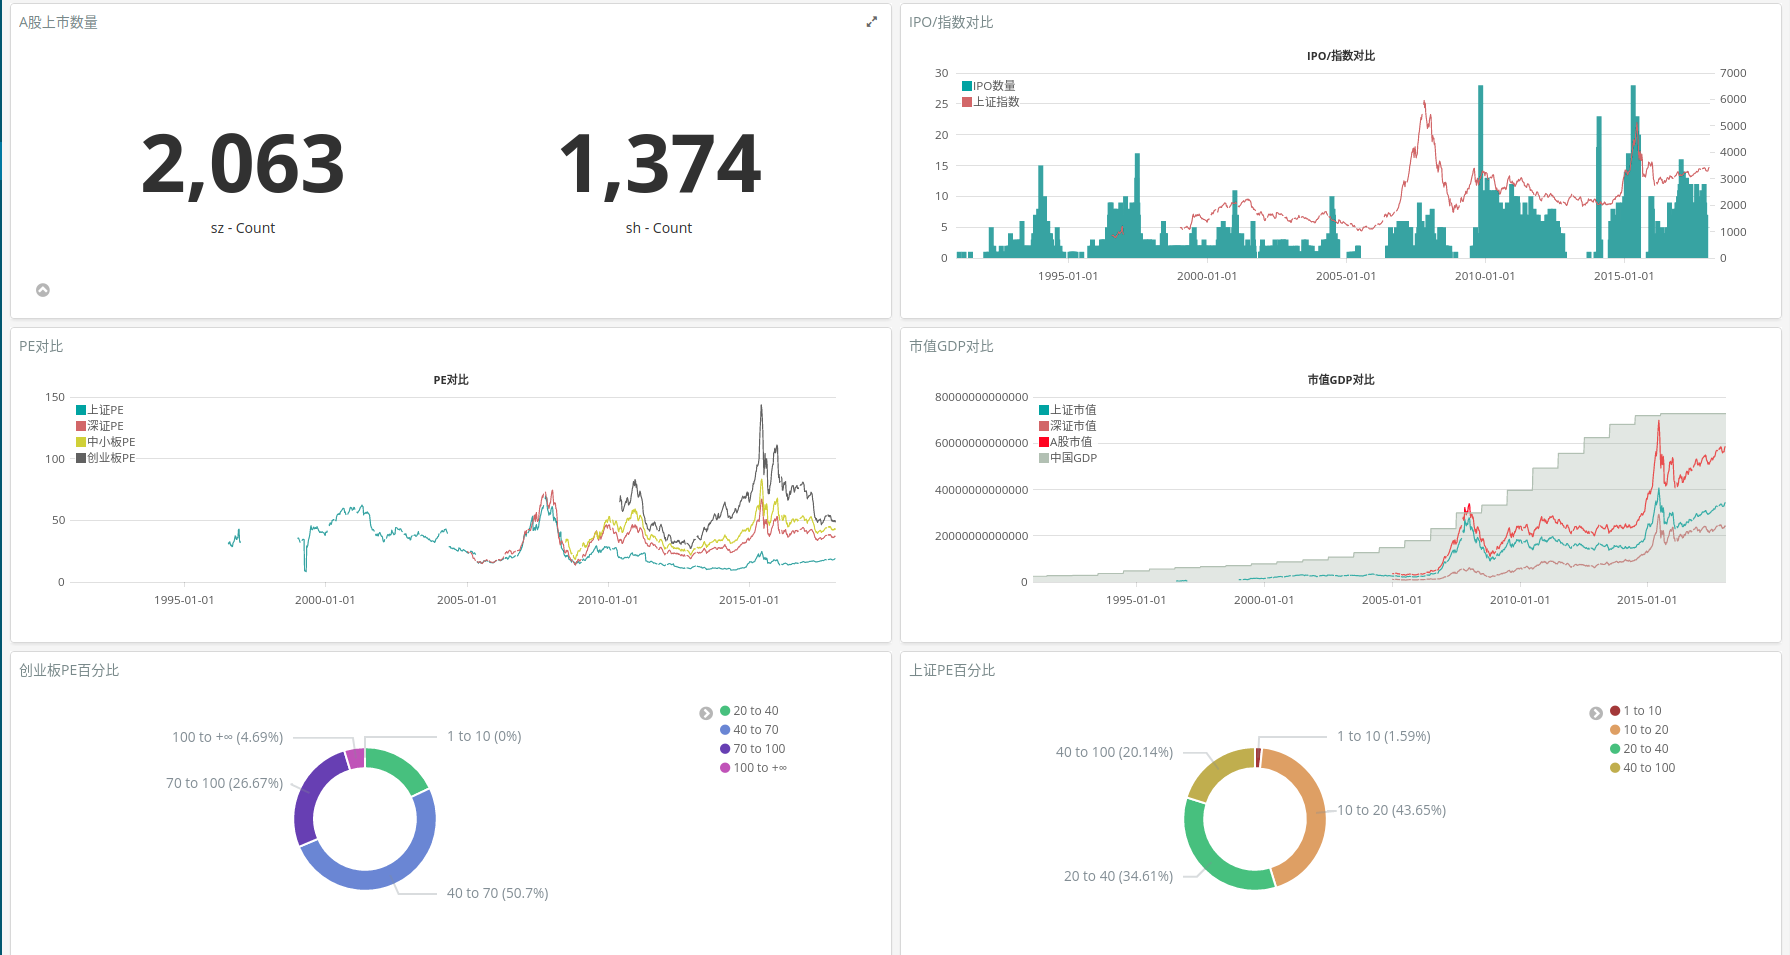
大势dashboard
API使用
获取利润表
In [1]: from fooltrader.api import finance
In [2]: finance.get_income_statement_items('300027',report_period='2017-06-30')
#试一试
#finance.get_balance_sheet_items('300027',,report_event_date='2017-01-01')
#finance.get_cash_flow_statement_items('300027')
Out[2]:
{'EPS': 0.15,
 'ManagingCosts': 257005115.85,
 'accumulatedOtherComprehensiveIncome': 471486112.3,
 'assetsDevaluation': -21647912.31,
 'attributableToMinorityShareholders': 90255906.93,
 'attributableToOwnersOfParentCompany': 381230205.37,
 'businessTaxesAndSurcharges': 80033207.21,
 'code': '300027',
 'dilutedEPS': 0.15,
 'disposalLossOnNonCurrentLiability': 281050.25,
 'exchangeGains': 0.0,
 'financingExpenses': 132202866.43,
 'id': 'stock_sz_300027_20170630',
 'incomeFromChangesInFairValue': 0.0,
 'incomeTaxExpense': 111864455.56,
 'investmentIncome': 541478955.17,
 'investmentIncomeFromRelatedEnterpriseAndJointlyOperating': '45035770.67',
 'minorityInterestIncome': 91203287.92,
 'netProfit': 521516997.38,
 'netProfitAttributedToParentCompanyOwner': 430313709.46,
 'nonOperatingExpenditure': 13775609.35,
 'nonOperatingIncome': 27864700.17,
 'operatingCosts': 679308123.4,
 'operatingProfit': 619292362.12,
 'operatingRevenue': 1465863805.45,
 'operatingTotalCosts': 1388050398.5,
 'otherComprehensiveIncome': -50030885.08,
 'reportDate': '2017-06-30',
 'reportEventDate': '2017-08-29',
 'securityId': 'stock_sz_300027',
 'sellingExpenses': 261148997.92,
 'totalProfits': 633381452.94}
财务报表的勾稽关系验证
# 营业利润=营业收入-营业成本-营业税金及附加-销售费用-管理费用-财务费用-资产减值损失+公允价值变动收益(损失的话用减)+投资收益
def check_operating_profit(security_item):
    income_statement_list = get_income_statement_items(security_item=security_item)
    for income_statement in income_statement_list:
        operatingProfit = income_statement["operatingRevenue"] \
                          - income_statement["operatingCosts"] \
                          - income_statement["businessTaxesAndSurcharges"] \
                          - income_statement["sellingExpenses"] \
                          - income_statement["ManagingCosts"] \
                          - income_statement["financingExpenses"] \
                          - income_statement["assetsDevaluation"] \
                          + income_statement["incomeFromChangesInFairValue"] \
                          + income_statement["investmentIncome"]
        diff = operatingProfit - income_statement["operatingProfit"]
        if abs(diff) >= 1:
            print("{} operating profit calculating not pass,calculating result:{},report result:{}".format(
                income_statement['id'], operatingProfit, income_statement["operatingProfit"]))
        else:
            print("{} operating profit calculating pass".format(income_statement['id']))
可以用该工具迅速检查财务报表的质量,同时也可以让你对财务报表有更深入的认识.
In [3]: from fooltrader.datamanager import finance_check

In [4]: finance_check.check_operating_profit('300027')
stock_sz_300027_20061231 operating profit calculating pass
...
stock_sz_300027_20170630 operating profit calculating pass
stock_sz_300027_20170930 operating profit calculating pass
我的博客介绍fooltrader投资之财务指标
行情信息
K线数据
In [5]: from fooltrader.api import quote

In [6]: quote.get_kdata('300027',start_date='20170630',end_date='20170715')
#试一试
#quote.get_kdata('300027',start_date='20170630',end_date='20170715',fuquan='qfq')
#quote.get_kdata('300027',start_date='20170630',end_date='20170715',fuquan='hfq')
Out[6]:
             timestamp    code  name   low  open  close  high    volume      turnover       securityId  preClose  change  changePct  turnoverRate          tCap          mCap  factor
timestamp
2017-06-30  2017-06-30  300027  华谊兄弟  8.03  8.11   8.09  8.11   9515735  7.684533e+07  stock_sz_300027      8.11   -0.02    -0.2466        0.3832  2.244575e+10  2.008766e+10  15.055
2017-07-03  2017-07-03  300027  华谊兄弟  8.07  8.09   8.20  8.22  15577742  1.270549e+08  stock_sz_300027      8.09    0.11     1.3597        0.6274  2.275095e+10  2.036079e+10  15.055
2017-07-04  2017-07-04  300027  华谊兄弟  8.12  8.20   8.15  8.22   8672705  7.068477e+07  stock_sz_300027      8.20   -0.05    -0.6098        0.3493  2.261222e+10  2.023664e+10  15.055
2017-07-05  2017-07-05  300027  华谊兄弟  8.11  8.15   8.19  8.22  12458305  1.017991e+08  stock_sz_300027      8.15    0.04     0.4908        0.5017  2.272320e+10  2.033596e+10  15.055
2017-07-06  2017-07-06  300027  华谊兄弟  8.17  8.20   8.20  8.29  18642574  1.533405e+08  stock_sz_300027      8.19    0.01     0.1221        0.7508  2.275095e+10  2.036079e+10  15.055
2017-07-07  2017-07-07  300027  华谊兄弟  8.13  8.18   8.17  8.19   9414275  7.679682e+07  stock_sz_300027      8.20   -0.03    -0.3659        0.3791  2.266771e+10  2.028630e+10  15.055
2017-07-10  2017-07-10  300027  华谊兄弟  8.08  8.18   8.09  8.19  12679949  1.029643e+08  stock_sz_300027      8.17   -0.08    -0.9792        0.5107  2.244575e+10  2.008766e+10  15.055
2017-07-11  2017-07-11  300027  华谊兄弟  8.06  8.10   8.08  8.13  11412820  9.235337e+07  stock_sz_300027      8.09   -0.01    -0.1236        0.4596  2.241801e+10  2.006283e+10  15.055
2017-07-12  2017-07-12  300027  华谊兄弟  7.93  8.07   8.03  8.10  13776145  1.104951e+08  stock_sz_300027      8.08   -0.05    -0.6188        0.5548  2.227928e+10  1.993868e+10  15.055
2017-07-13  2017-07-13  300027  华谊兄弟  8.09  8.10   8.28  8.37  43554957  3.590739e+08  stock_sz_300027      8.03    0.25     3.1133        1.7541  2.297291e+10  2.055944e+10  15.055
2017-07-14  2017-07-14  300027  华谊兄弟  8.23  8.25   8.41  8.55  37967053  3.193673e+08  stock_sz_300027      8.28    0.13     1.5700        1.5291  2.333359e+10  2.088223e+10  15.055
tick数据
In [7]: for tick in quote.get_ticks('300027',the_date='2017-07-03'):
    ...:     print(tick)
    ...:
    ...:
#试一试
#quote.get_ticks('300027',start='2017-06-30',end='2017-07-10')
                               timestamp  price  volume  turnover  direction    code       securityId
timestamp
2017-07-03 09:25:03  2017-07-03 09:25:03   8.09      41     33169          1  300027  stock_sz_300027
2017-07-03 09:30:03  2017-07-03 09:30:03   8.09      10      8090          1  300027  stock_sz_300027
...                                  ...    ...     ...       ...        ...     ...              ...
2017-07-03 14:57:00  2017-07-03 14:57:00   8.19       4      3276         -1  300027  stock_sz_300027
2017-07-03 14:57:03  2017-07-03 14:57:03   8.19       0         0         -1  300027  stock_sz_300027
2017-07-03 15:00:03  2017-07-03 15:00:03   8.20    4394   3603079          1  300027  stock_sz_300027

[2313 rows x 7 columns]
事件(消息)数据
In [8]: from fooltrader.api import event

In [9]: for item in event.get_forecast_items('000338'):
   ...:     print(item)
   ...:
{'changeStart': None, 'reportDate': '2008-01-28', 'id': 'stock_sz_000338_2008-01-28', 'preEPS': None, 'securityId': 'stock_sz_000338', 'reportPeriod': '2007-12-31', 'description': '潍柴动力预计2007年1-12月净利润较2006年度备考合并净利润增长约140%左右。', 'change': 1.4, 'type': '预增'}
{'changeStart': None, 'reportDate': '2008-07-24', 'id': 'stock_sz_000338_2008-07-24', 'preEPS': 1.87, 'securityId': 'stock_sz_000338', 'reportPeriod': '2008-06-30', 'description': '预计本公司2008年1-6月归属于母公司所有者净利润与2007年同期调整前及调整后的归属于母公司所有者净利润相比增长50%-100%之间。', 'change': 1.0, 'type': '预增'}
{'changeStart': None, 'reportDate': '2009-08-19', 'id': 'stock_sz_000338_2009-08-19', 'preEPS': 3.19, 'securityId': 'stock_sz_000338', 'reportPeriod': '2009-06-30', 'description': '预计本公司2009年半年度营业收入约为人民币158亿元,营业利润约在人民币15-18亿元之间,利润总额约在人民币15-18亿元之间,归属于上市公司股东的净利润约在人民币10.0-12.5亿元之间。', 'change': 0.0, 'type': '预降'}
...
{'changeStart': 1.4, 'reportDate': '2017-04-14', 'id': 'stock_sz_000338_2017-04-14', 'preEPS': 0.11, 'securityId': 'stock_sz_000338', 'reportPeriod': '2017-03-31', 'description': '预计2017年1-3月归属于上市公司股东的净利润为:109,600.00万元至123,300.00万元,较上年同期相比变动幅度:140.00%至170.00%。', 'change': 1.7, 'type': '预增'}
{'changeStart': 0.7, 'reportDate': '2017-04-28', 'id': 'stock_sz_000338_2017-04-28', 'preEPS': 0.26, 'securityId': 'stock_sz_000338', 'reportPeriod': '2017-06-30', 'description': '预计2017年1-6月归属于上市公司股东的净利润为:183,000.00万元至215,000.00万元,较上年同期相比变动幅度:70.00%至100.00%。', 'change': 1.0, 'type': '预增'}
{'changeStart': 1.5, 'reportDate': '2017-08-31', 'id': 'stock_sz_000338_2017-08-31', 'preEPS': 0.38, 'securityId': 'stock_sz_000338', 'reportPeriod': '2017-09-30', 'description': '预计2017年1-9月归属于上市公司股东的净利润为:385,000.00万元至431,400.00万元,较上年同期相比变动幅度:150.00%至180.00%。', 'change': 1.8, 'type': '预增'}
技术指标
In [10]: from fooltrader.api import technical
In [11]: technical.macd('000778',start_date='20170101',end_date='20170301')
Out[11]:
            close  close_ema12  close_ema26      diff       dea      macd
timestamp
2017-01-03   5.21          NaN          NaN       NaN       NaN       NaN
2017-01-04   5.24          NaN          NaN       NaN       NaN       NaN
2017-01-05   5.31          NaN          NaN       NaN       NaN       NaN
2017-01-06   5.28          NaN          NaN       NaN       NaN       NaN
2017-01-09   5.33          NaN          NaN       NaN       NaN       NaN
2017-01-10   5.30          NaN          NaN       NaN       NaN       NaN
2017-01-11   5.34          NaN          NaN       NaN       NaN       NaN
2017-01-12   5.21          NaN          NaN       NaN       NaN       NaN
2017-01-13   5.11          NaN          NaN       NaN       NaN       NaN
2017-01-16   4.95          NaN          NaN       NaN       NaN       NaN
2017-01-17   5.00          NaN          NaN       NaN       NaN       NaN
2017-01-18   5.05     5.146697          NaN       NaN       NaN       NaN
2017-01-19   4.96     5.117975          NaN       NaN       NaN       NaN
2017-01-20   5.00     5.099825          NaN       NaN       NaN       NaN
2017-01-23   5.05     5.092159          NaN       NaN       NaN       NaN
2017-01-24   5.06     5.087212          NaN       NaN       NaN       NaN
2017-01-25   5.06     5.083025          NaN       NaN       NaN       NaN
2017-01-26   5.07     5.081022          NaN       NaN       NaN       NaN
2017-02-03   5.03     5.073172          NaN       NaN       NaN       NaN
2017-02-06   5.03     5.066530          NaN       NaN       NaN       NaN
2017-02-07   5.01     5.057833          NaN       NaN       NaN       NaN
2017-02-08   5.05     5.056628          NaN       NaN       NaN       NaN
2017-02-09   5.12     5.066378          NaN       NaN       NaN       NaN
2017-02-10   5.27     5.097704          NaN       NaN       NaN       NaN
2017-02-13   5.31     5.130365          NaN       NaN       NaN       NaN
2017-02-14   5.84     5.239540     5.184121  0.055419  0.055419  0.000000
2017-02-15   6.09     5.370380     5.251223  0.119157  0.068166  0.101981
2017-02-16   5.98     5.464167     5.305206  0.158961  0.086325  0.145271
2017-02-17   5.70     5.500449     5.334450  0.165999  0.102260  0.127478
2017-02-20   5.78     5.543457     5.367454  0.176003  0.117009  0.117989
2017-02-21   5.81     5.584464     5.400235  0.184229  0.130453  0.107552
2017-02-22   5.95     5.640700     5.440959  0.199742  0.144310  0.110862
2017-02-23   5.81     5.666746     5.468295  0.198451  0.155139  0.086625
2017-02-24   5.69     5.670324     5.484718  0.185606  0.161232  0.048748
2017-02-27   5.59     5.657966     5.492516  0.165450  0.162076  0.006749
2017-02-28   5.66     5.658279     5.504922  0.153357  0.160332 -0.013950
2017-03-01   5.63     5.653928     5.514187  0.139741  0.156214 -0.032945
我们不需要那么多技术指标,但一定要知道所使用指标的内涵,所以,我们选择自己计算;没错,由于数据的统一性,理所当然地,计算的统一性也有了. 不管是A股,港股,还是数字货币,不管是1分钟级别,还是日线,使用的都是统一的api.
更多用法请查看api文档.
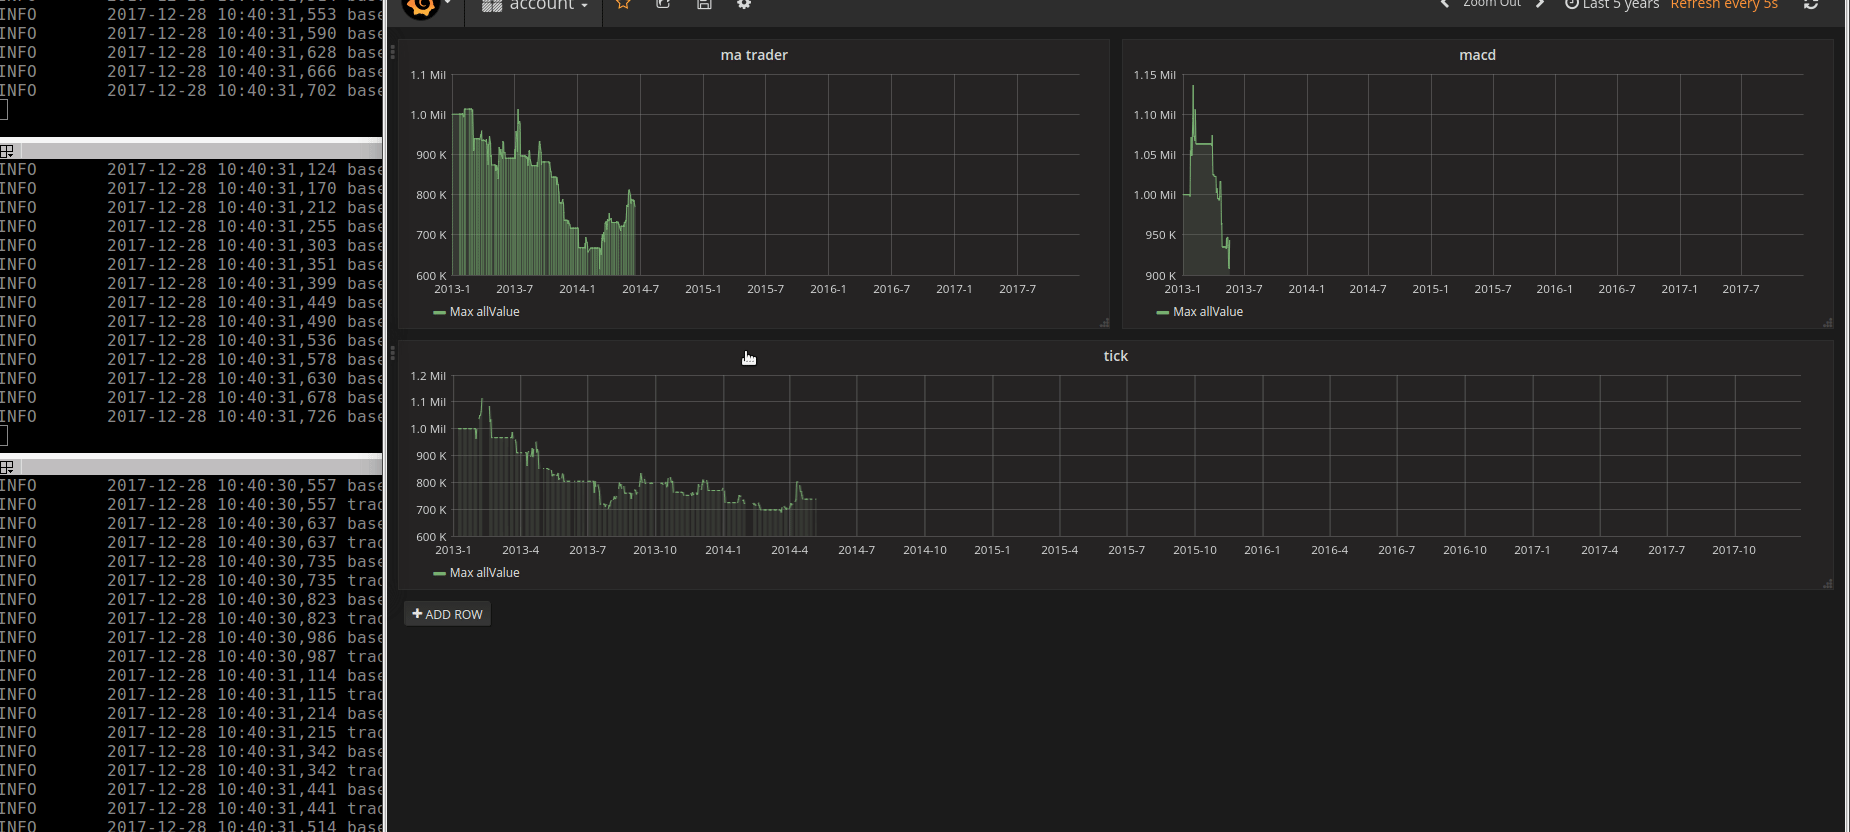
回测
策略的编写,可以采用事件驱动或者时间漫步的方式,查看设计文档
注意:回测框架目前还处于非常初期的阶段
class EventTrader(Trader):
    def on_init(self):
        self.trader_id = 'aa'
        self.only_event_mode = True
        self.universe = ['stock_sz_000338']
        self.df_map = {}

    def on_day_bar(self, bar_item):
        current_security = bar_item['securityId']
        current_df = self.df_map.get(current_security, pd.DataFrame())
        if current_df.empty:
            self.df_map[current_security] = current_df

        current_df = current_df.append(bar_item, ignore_index=True)
        self.df_map[current_security] = current_df

        if len(current_df.index) == 10:
            ma5 = np.mean(current_df.loc[5:, 'close'])
            ma10 = np.mean(current_df.loc[:, 'close'])
            # 5日线在10日线上,并且没有持仓,就买入
            if ma5 > ma10 and not self.account_service.get_position(current_security):
                self.buy(security_id=current_security, current_price=bar_item['close'])
            # 5日线在10日线下,并且有持仓,就卖出
            elif ma5 < ma10 and self.account_service.get_position(current_security):
                self.sell(security_id=current_security, current_price=bar_item['close'])
            current_df = current_df.loc[1:, ]
            self.df_map[current_security] = current_df
运行策略可以实时查看效果,并做进一步的评估
最后,说真的:
项目会持续做下去,因为我要用……
欢迎大家提意见
如果能给你的投资节省一些时间,那就真的阿弥陀佛了
当然,它只是一个工具,人的思想才是最重要的